Work / A spatial-data visualization platform and interactive exhibits at Ars Electronica Center.GeoPulse & interactive exhibits
Context
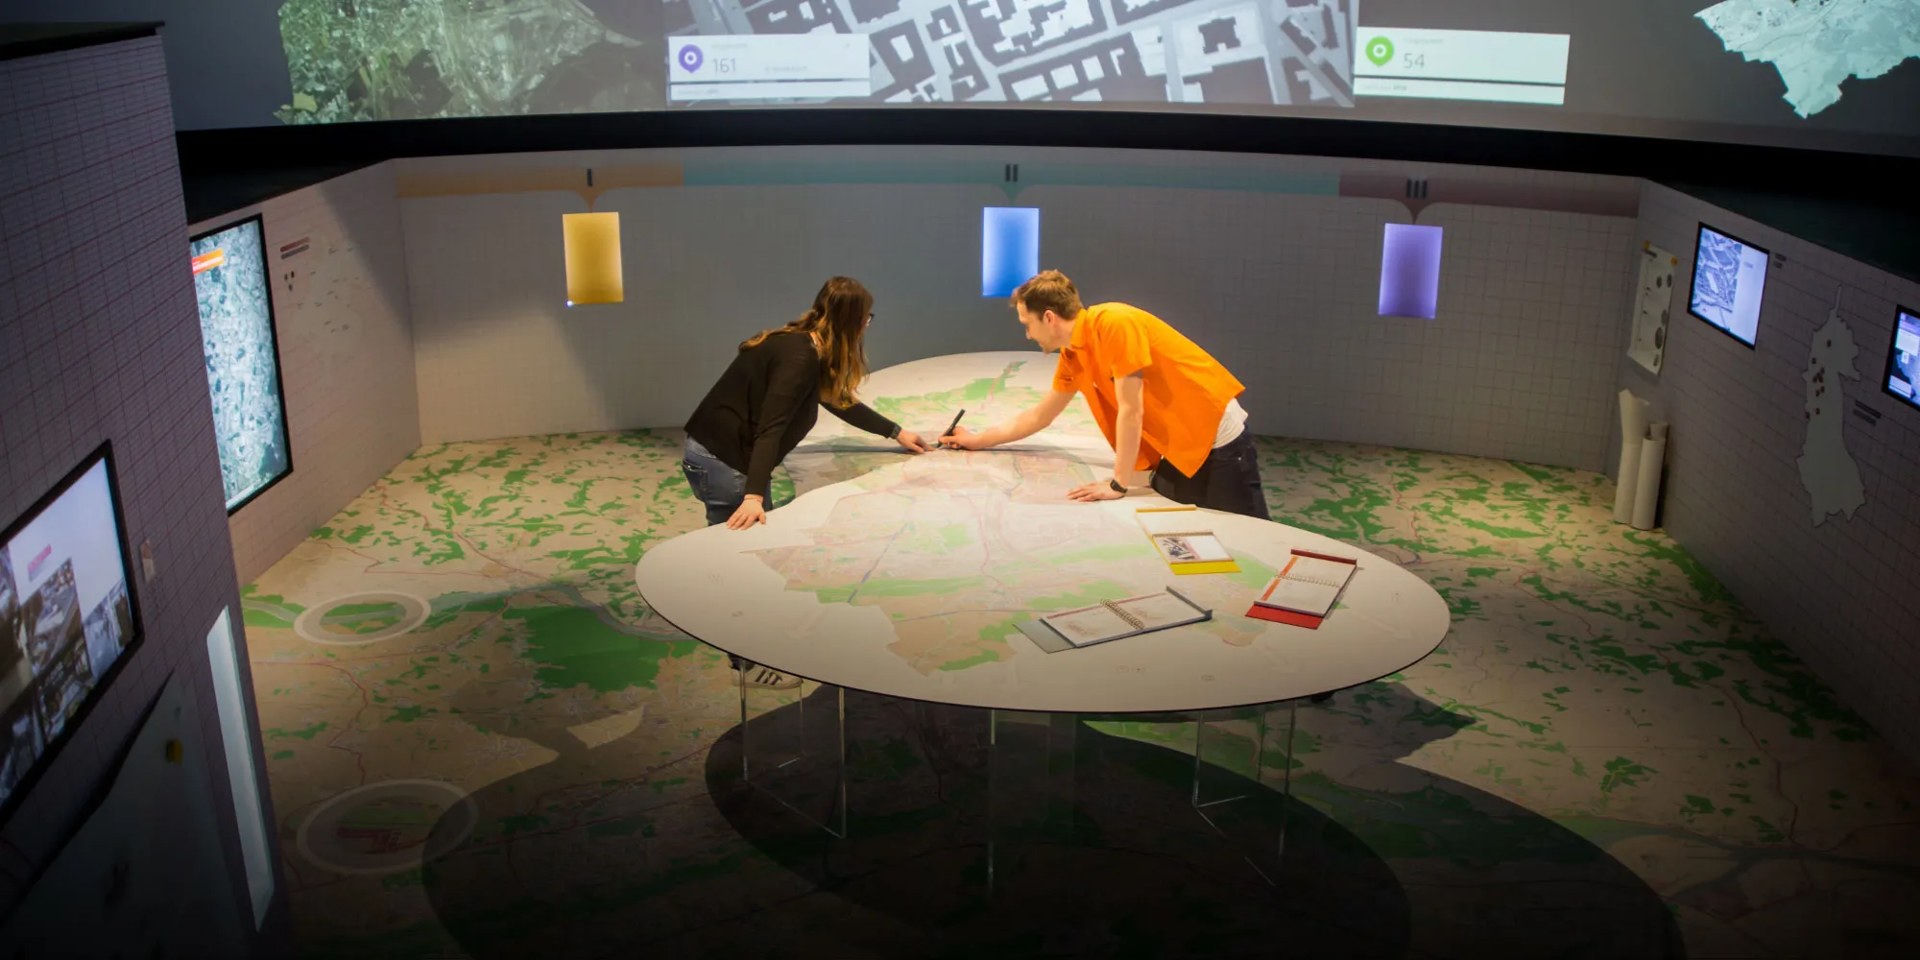
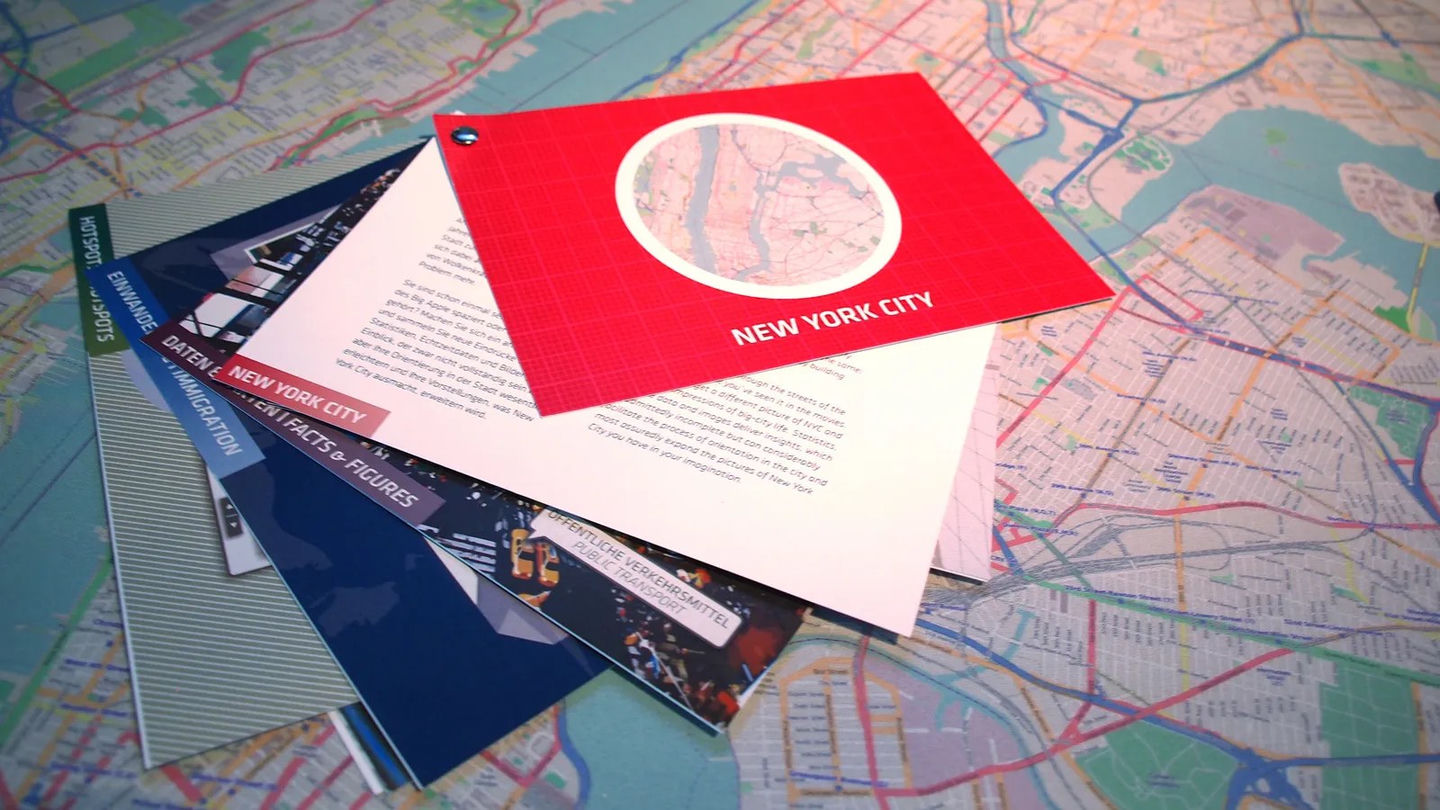
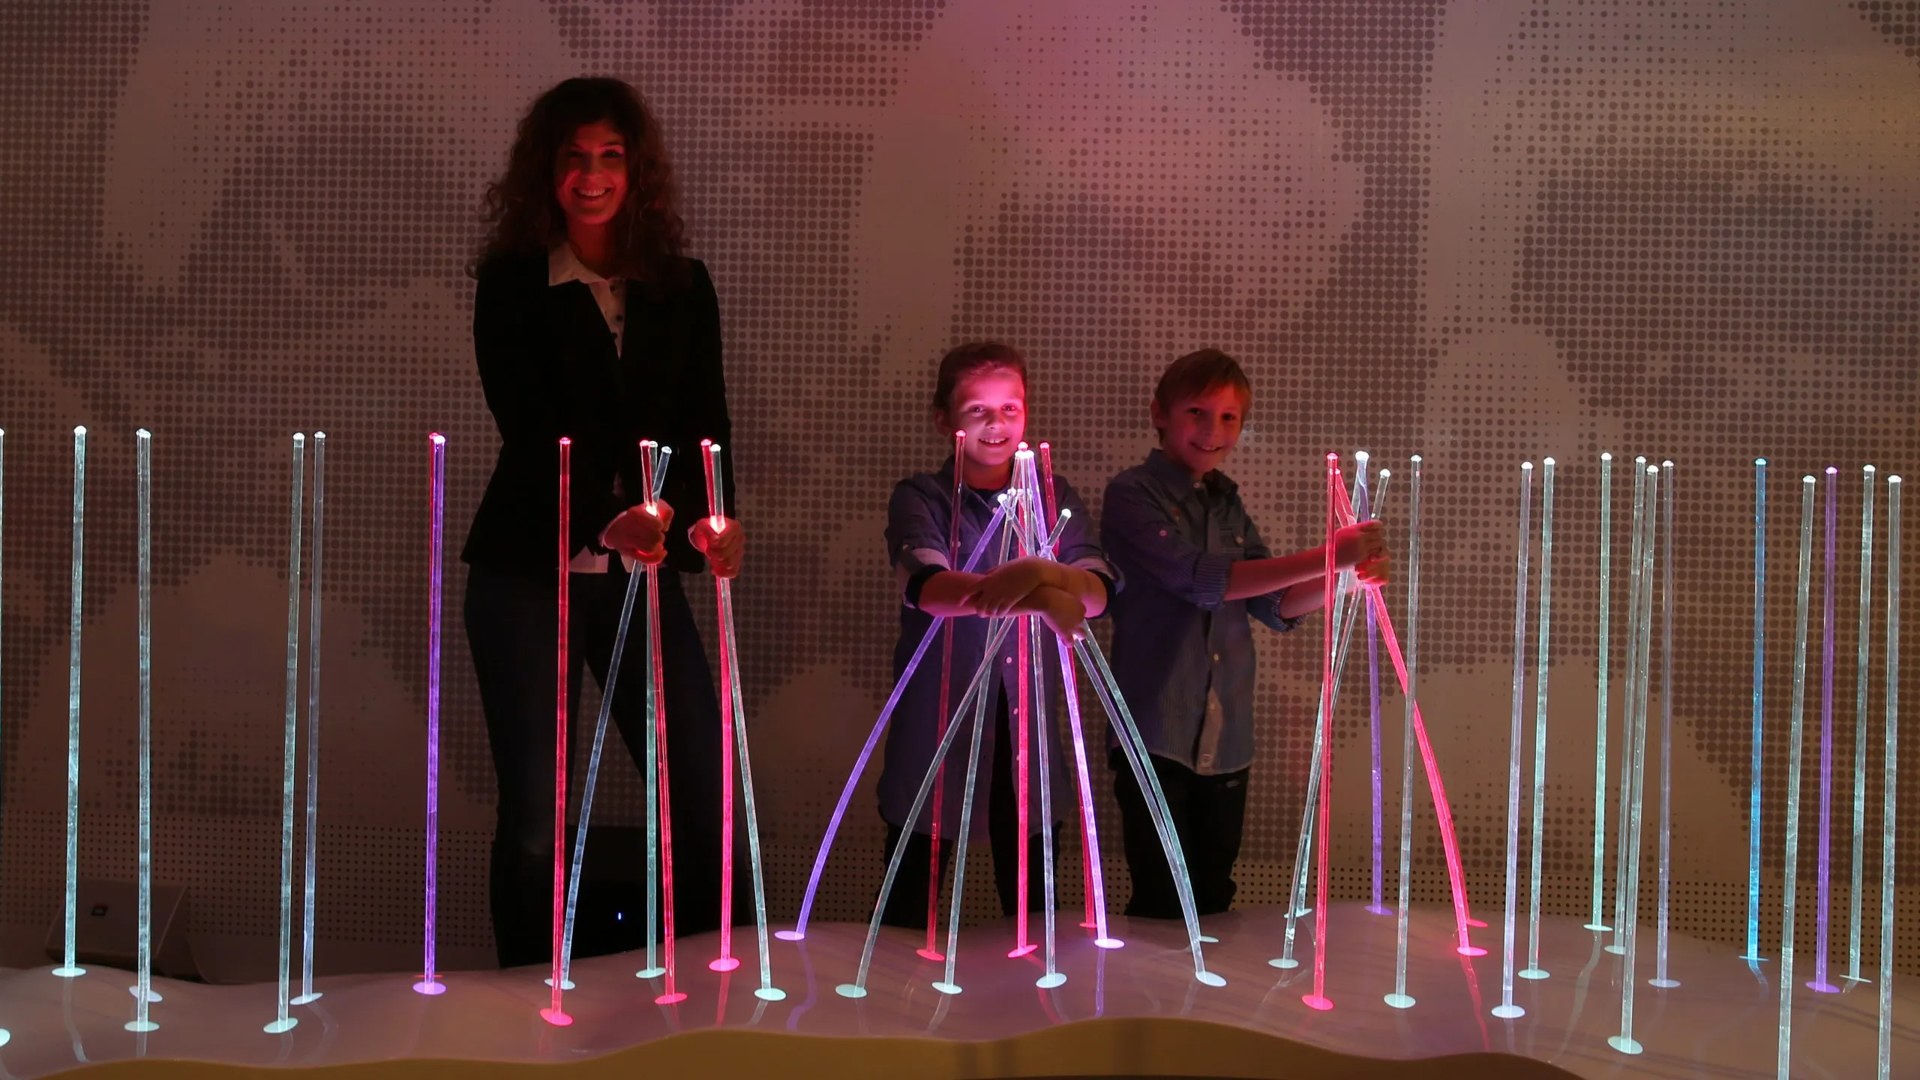
I spent three years as a Creative Engineer at Ars Electronica in Linz, building interactive and new-media installations for the center and its partners. I was lead developer of GeoPulse, a platform for accessible visualization of spatial data. Other work included Techkriti 2012's "Brain Battle" and exhibits for MED-EL's Audioversum.
The problem
Museum exhibits need to run for a full day, seven days a week, for years. Visitors include small children, and the interface has to make sense to someone who stops for eight seconds, without requiring instructions.
For GeoPulse, I had to make spatial datasets understandable to visitors who did not use specialist GIS tools, while keeping the visualization responsive.
What I did
- Led development of GeoPulse, the spatial-data visualization platform.
- Built the interactive and computer-vision software for the center's installations and partner exhibits (C++, Python, OpenGL, OpenCV).
- Worked on exhibits from concept and implementation through the reliability work needed to run them unattended.
Stack & notes
C++ · Python · OpenGL · OpenCV.